The reality of providing online content in 2019 is that all visitors to our public website have distinct needs and abilities. As a local government, the City of Seattle is responsible for providing access to digital information and services for all residents. We strive to create an inclusive experience.
In the City’s 2018 Technology Access and Adoption Study, almost one-quarter of the respondents fall into a segment labeled “digitally cautious.” This segment represents residents who have limited their internet use because of concerns about the privacy and security of their online interactions. It’s important to build trust with our residents; with consistent design and processes we can ensure that our website is easily identifiable as belonging to and representing the City of Seattle.
As we identified patterns in the way residents engage with the City online, two concepts merged together:
- The need to create and display the rules for interacting in online forums.
- The need to provide simple and clear information about how the City of Seattle manages its website and makes design decisions.
With one portal consisting of a few pages, we’re able to describe our human-centered approach to user experience, highlight our commitment to accessibility, introduce our existing digital programs that support the public, and showcase analytics we’ve collected about user behavior.

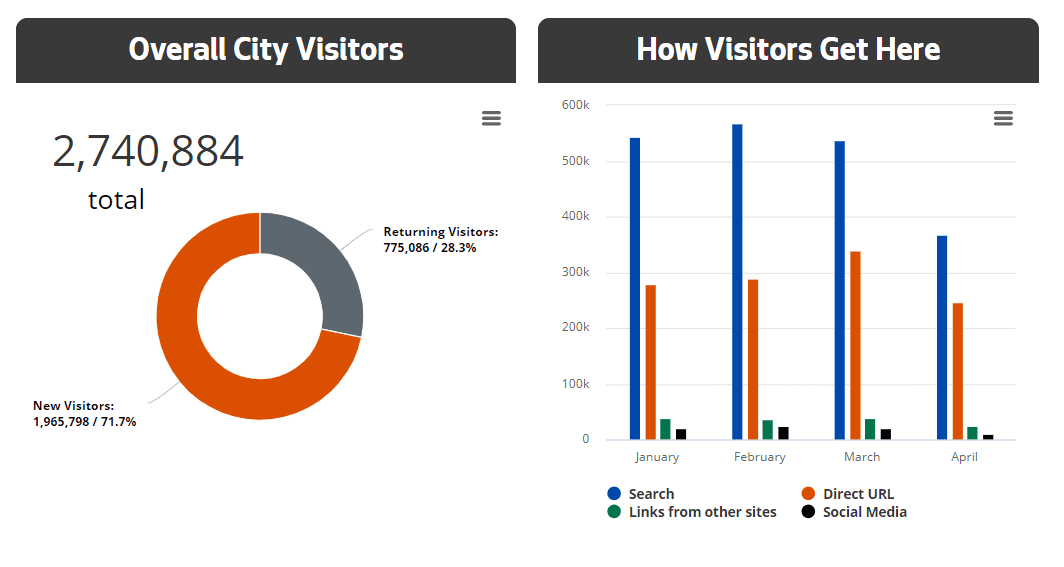
We decided to make our web analytics publicly available in a dashboard format and illustrate a comprehensive reflection of our residents. When do you visit? How did you get here? What are you doing here? Drawing from the federal government’s analytics page, we reviewed and compared various online dashboards. We selected data points in Google Analytics that told a story about our website visitors with visualizations through a JavaScript-based charting library called Highcharts. We displayed our active web visitors with 10-minute intervals using Google’s superProxy. Finally, we performed an unmoderated usability test to validate that the charts and interactions made sense. The results have informed refinement of the language used in our dashboard and we’ll continue to study reactions for further improvements.

Explore more at https://www.seattle.gov/digital.
About the Digital Services Team

Michal Perlstein leads Digital Services for Seattle IT. The team consists of designers, developers, and producers who continuously innovate on the technology platforms that enable City departments to communicate effectively with the public and fulfill their expectation to access City information on any computer or device. The expertise among the members of the Digital Services Team brings increased consistency, usability, and accessibility to the City’s digital communications.