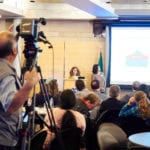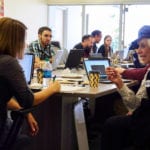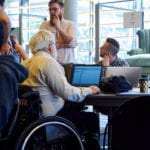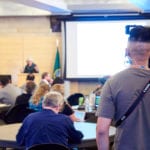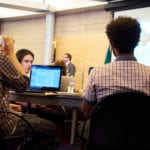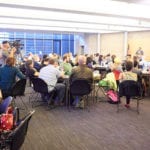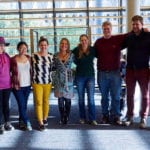
The City for All hackathon was a big civic hit over the weekend. Nine teams competed for recognition and prizes at City Hall’s Bertha Knight Landes room. The theme of the hackathon was to find solutions for the challenges of aging and accessibility. The winner for Best Overall Innovation was the Pandora for Streets/Smellevation Maps team which addressed several of the eight domains of livability in a single app. The app would also include paths in Seattle that present the best smells, sounds, views, and hills. Users can rank how important each aspect is to improve the algorithms of the app. The winner of Best Accessibility Hack was GoInfo Game which gamified the collection of bus stop information that’s crucial for disabled riders. The Winner of Best Use of Open Data and and Best Data Visualization was SeaSidewalks which developed a visualization of data from SDOT’s recent Citywide sidewalk analysis. The team came up with a mechanism for prioritizing sidewalk issues based on factors like proximity to hospitals and other key facilities.
Here’s a complete list of the results and links to team projects:
- Team Pandora for Streets won Best Overall Innovation with a map to generate better pedestrian experiences. It aims to crowdsource information not typically considered when evaluating the urban environment with data – such as noises and smells – in addition to mapping elements such as tree canopy and points of interest from 10 sources of open data from the city, county, and federal government.
- Team Reflect & Connect was runner-up for Best Overall Innovation. It used the magic of technology to transform written or spoken journal entries into suggested free activities in the city, with the goal of helping people overcome loneliness and social isolation.
- Team SeaSidewalks won in two categories: Best Use of Open Data and Best Data Visualization. The tool visualizes data from Seattle Department of Transportation’s recent sidewalk assessment, prioritizing issues as well as points of interest, such as medical facilities, and demographics, to help the Department make the best use of its limited sidewalk repair budget. It can be viewed at https://gngu.shinyapps.io/seattle_sidewalks/.
- Team GoInfo Game won Best Accessibility Hack with a tool that gamifies crowdsourcing of bus stop data that’s critical for disabled and/or older riders, then makes that data available for use in other tools. The source code is available at https://github.com/opensidewalks/goinfogame.
- Team Speedy Wheels was runner-up for Best Accessibility Hack, addressing the challenge of requesting specialized rides from public and volunteer services. Currently, for older or disabled riders, finding a ride can be a time-consuming challenge involving numerous phone calls and emails. Check out the presentation from Speedy Wheels at https://docs.google.com/presentation/d/1WF769VnMLI5KRlSgva6cVgCNN0ORDtl2ugF8mdPC5cc/edit#slide=id.g25763da086_0_0.
- Team Find a Ride++ also created a website to simplify the experience of finding a specialized ride throughout King County. The tool can be viewed at https://deeglaze.github.io/findaride_hack/.
- Team Access for Services created a dashboard visualizing demographic data alongside Aging & Disability Services data.
- Team SeaViz used virtual reality to visualize 7 years of Aging & Disability Services data on a 3D map of Seattle.
- Team It’s All Downhill From Here created a taxonomy for road information that could be useful to other app builders.
